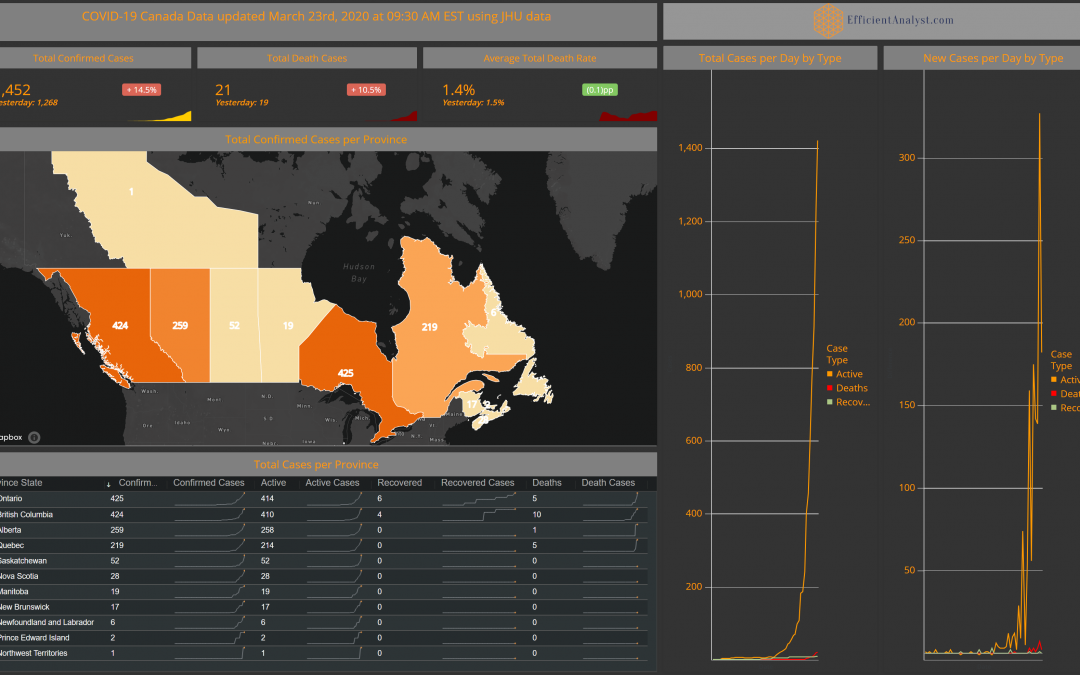
COVID-19 Canada March 23, 2020 update
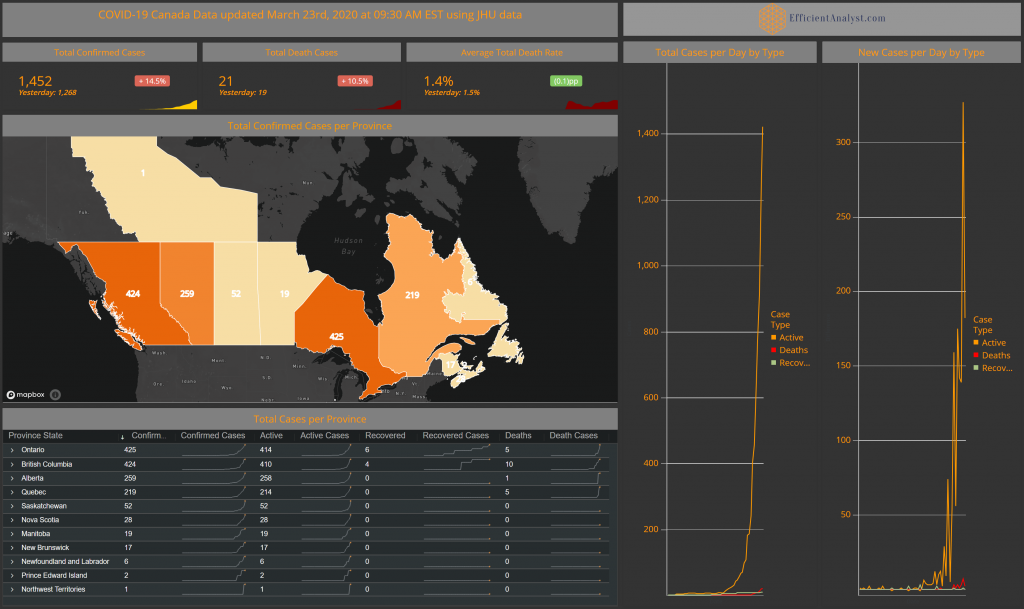


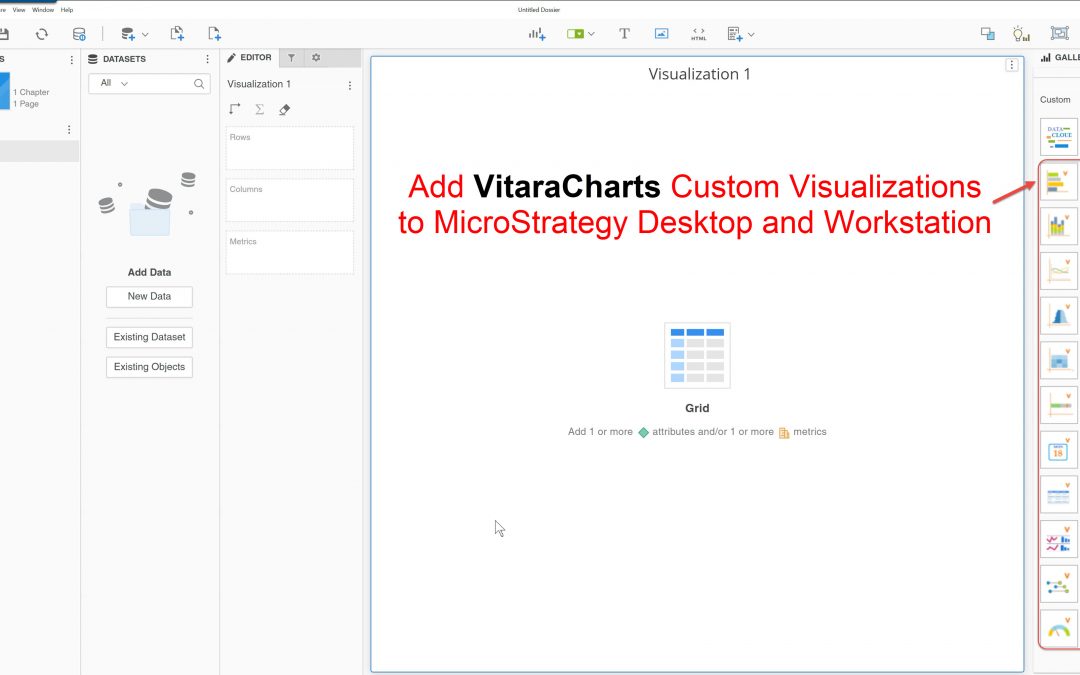
In this tutorial, I show how to add custom visualizations to MicroStrategy Desktop and Workstation such as VitaraCharts. VitaraCharts is a set of custom visualizations available from vitaracharts.com for free for MicroStrategy Desktop and Workstation, and for a license for MicroStrategy Web.
Requirements:
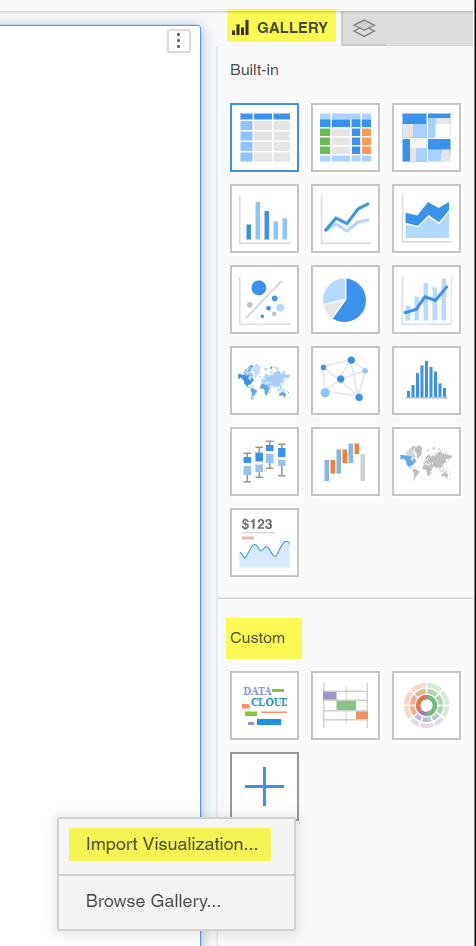
In the Gallery Panel, in the Custom section, click the + sign and select Import Visualization
Browse to the location of your saved visualization, and select your visualization. You do not need to unzip it first, as long as it is in .viz or .zip format it should work.
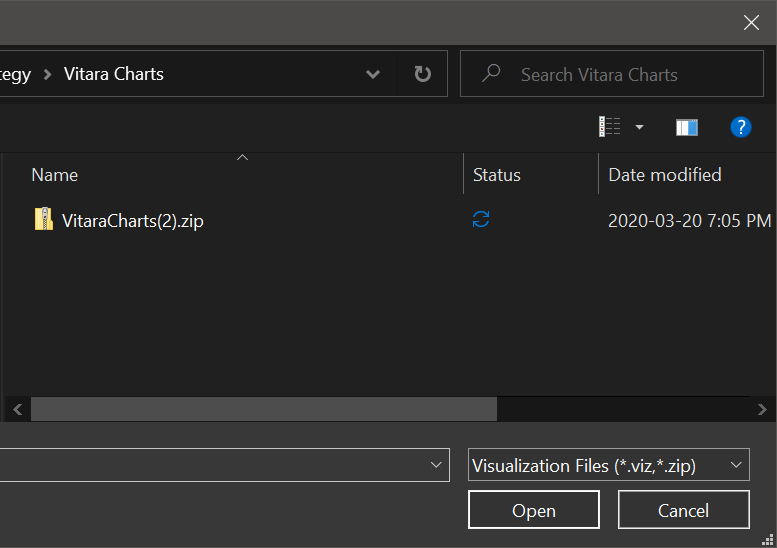
Enjoy your new Visualizations!

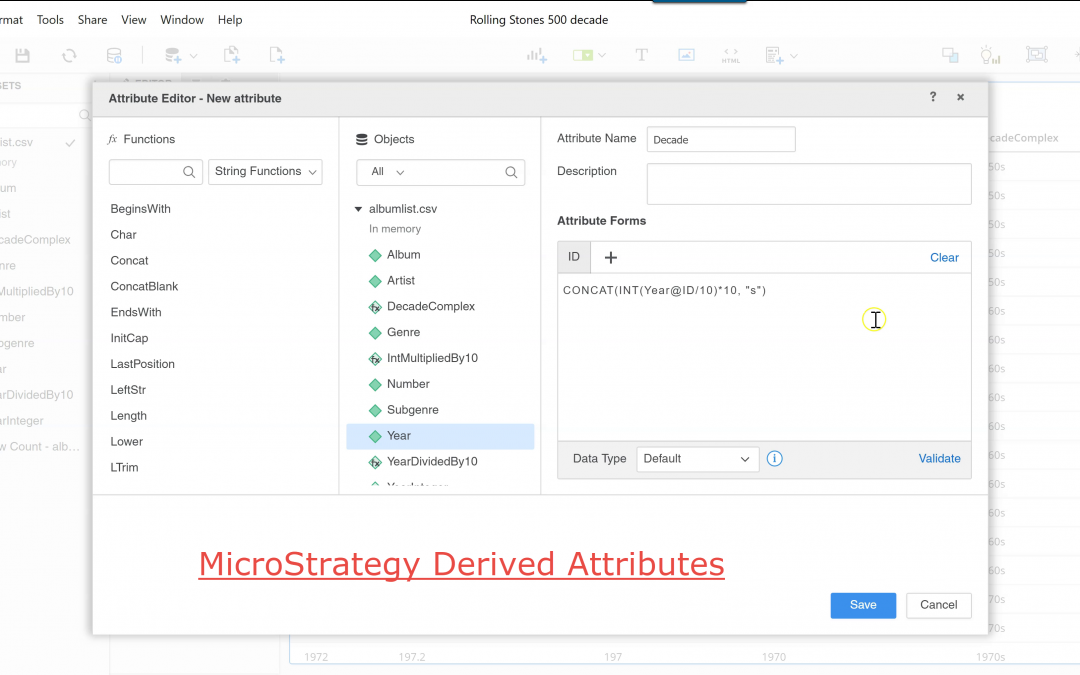
In this tutorial, I show how to create a derived attribute in MicroStrategy. In this example, we convert years to decades.
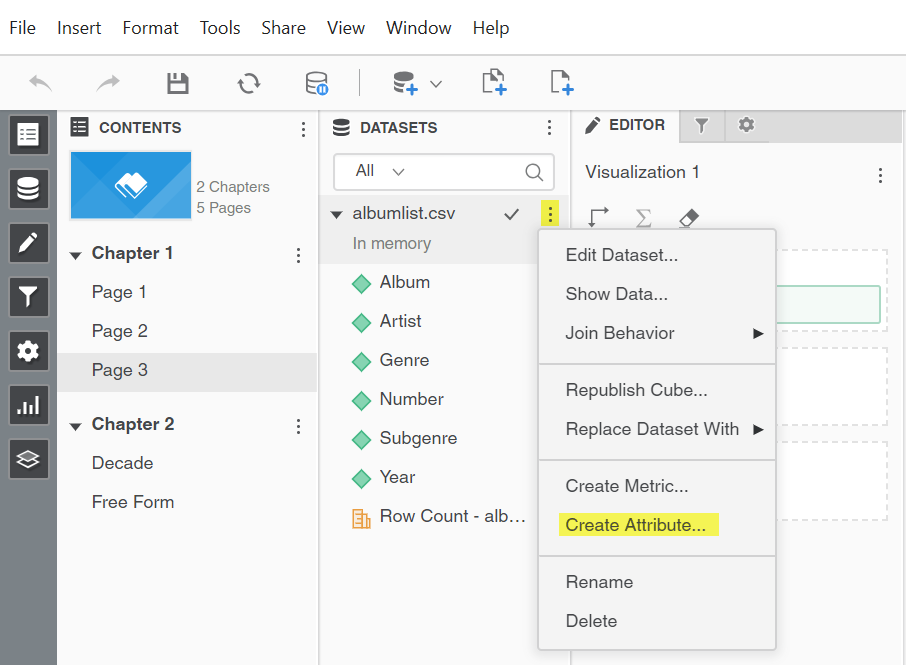
To create a MicroStrategy Derived Attribute, click the option button (ellipsis …) next to your dataset. In the drop-down menu, select Create Attribute. I will first show how to build this derived attribute in sections, and in the end we will combine all the sections together.
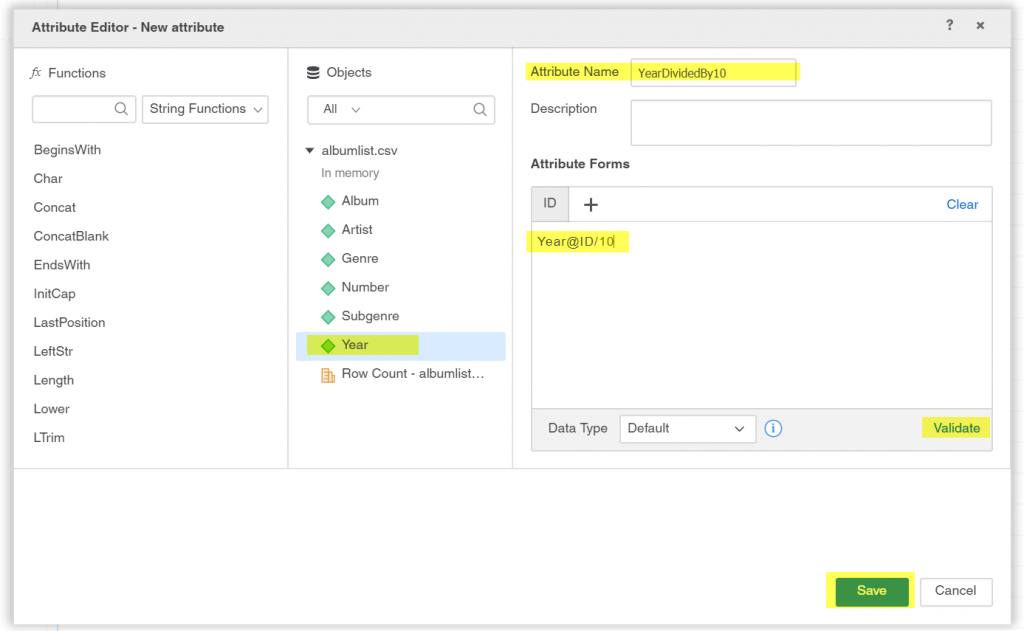
In the Attribute Editor window, give your new attribute a name.
Double click the Year attribute to bring the Year@ID text in the Attribute Forms box. Add /10 to divide the year by 10.
Click Validate to have MicroStrategy validate your formula.
Click Save to save the new attribute.
Add the Year attribute and your newly created YearDividedBy10 attribute to a grid to see your progress so far.

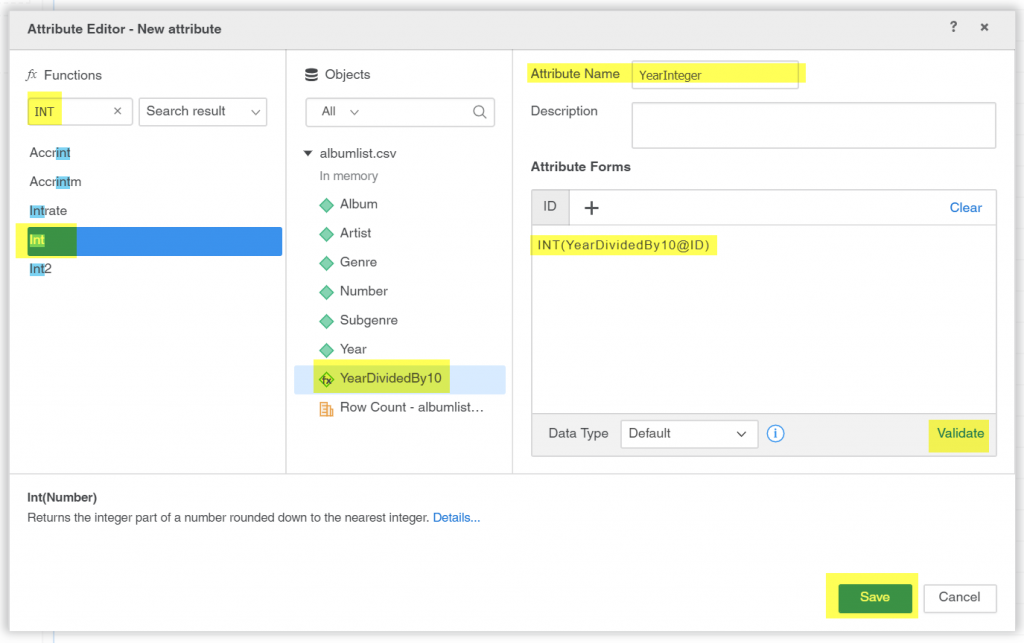
Create the next Attribute, YearInteger, using the same method. This time we will use the Int() function. You can search for the Int function in the Functions section, or you can type in INT(YearDividedBy10@ID).
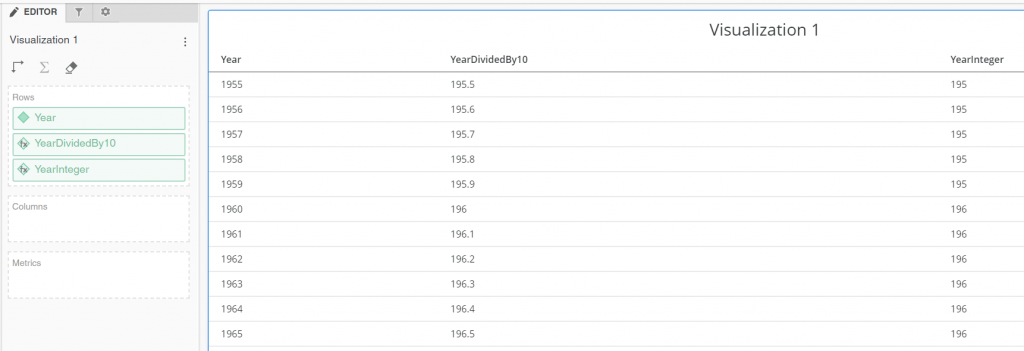
Add your new attribute to the grid to see your progress so far.
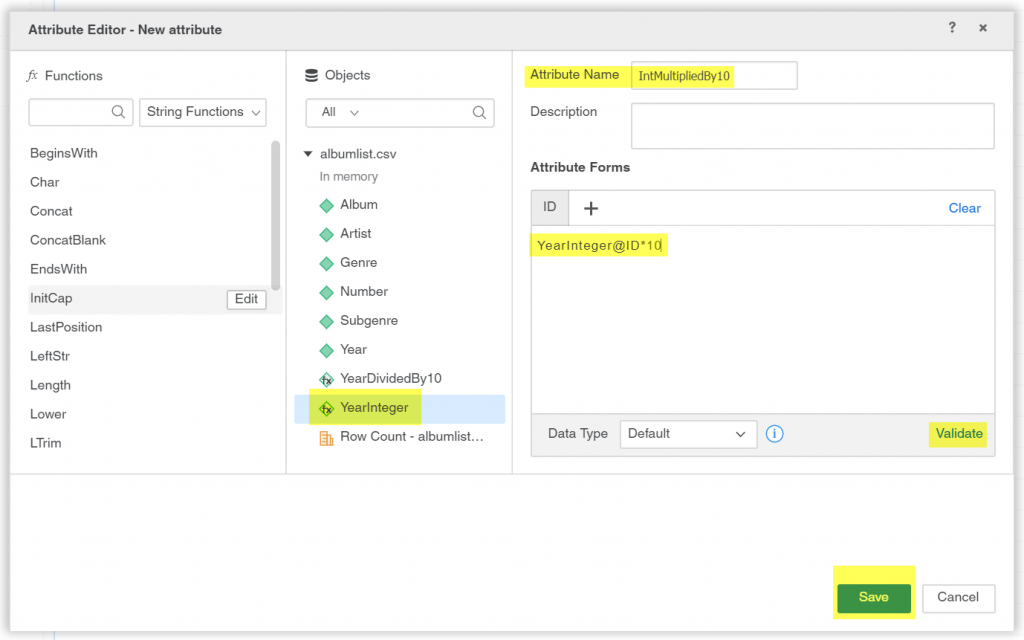
Create the next attribute, IntMultipliedBy10 the same way you created the other attributes. In this case, you multiply by 10: YearInteger@ID * 10.
Add your new attribute to the grid to see your progress.

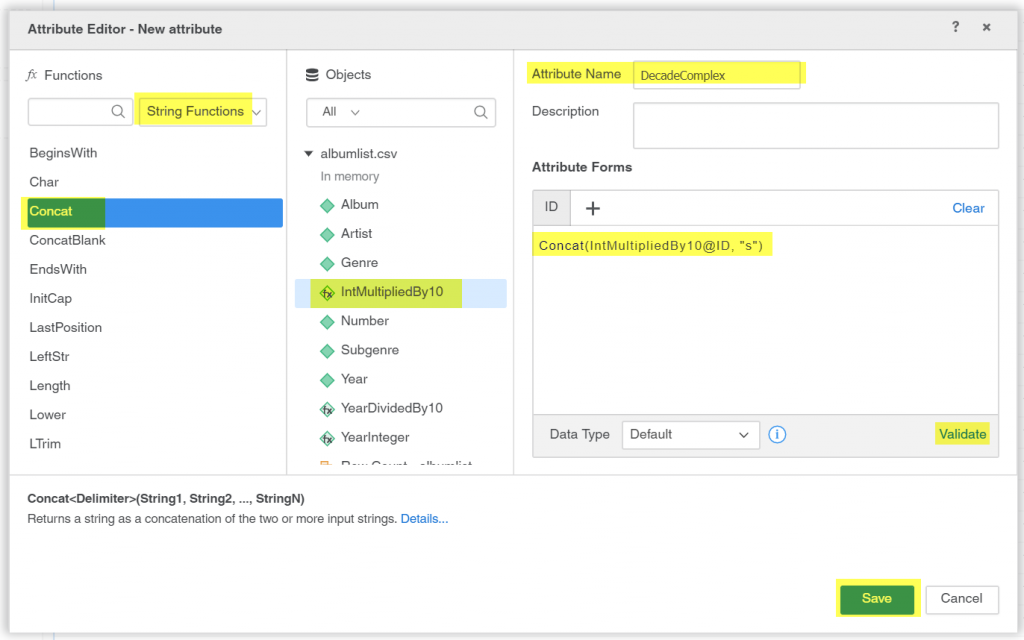
Create the final attribute, DecadeComplex, which will use the Concat() function to add an “s” at the end, as decades are usually expressed as the 1950s, 1960s, etc.
Add the final attribute to the grid to see the final result.

We could very well stop here, but as an added challenge, let’s combine all the steps into a single MicroStrategy Derived Attribute, to see how you can combine multiple formulas together.
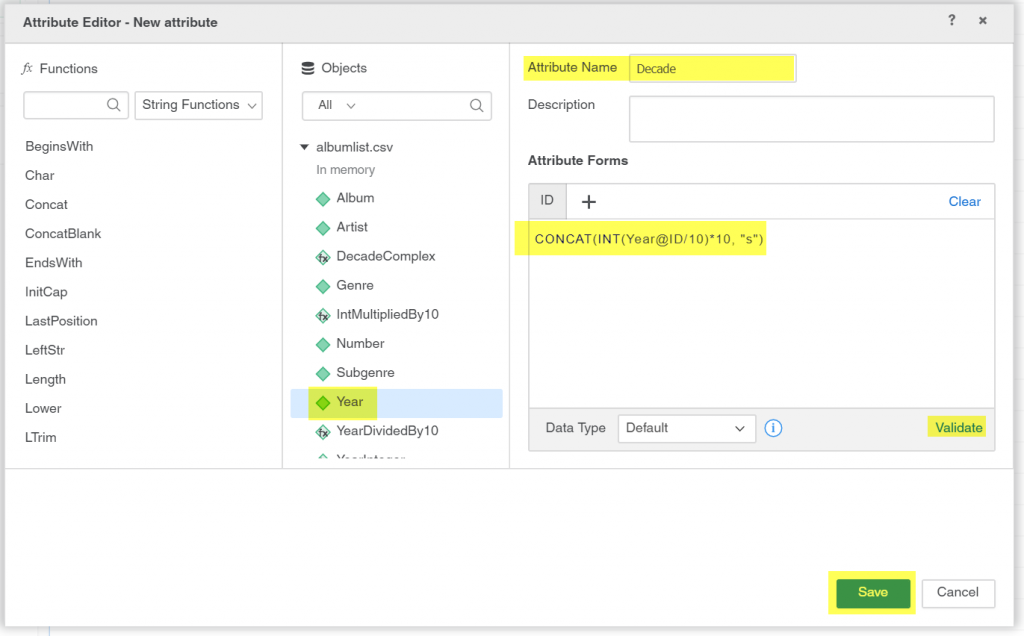
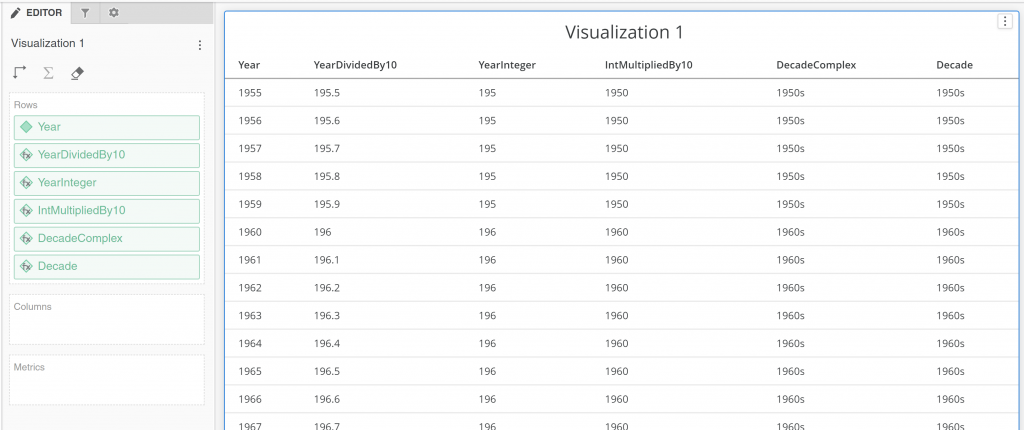
If you add this new Decade attribute to the grid, you can see it gives the same results as before.
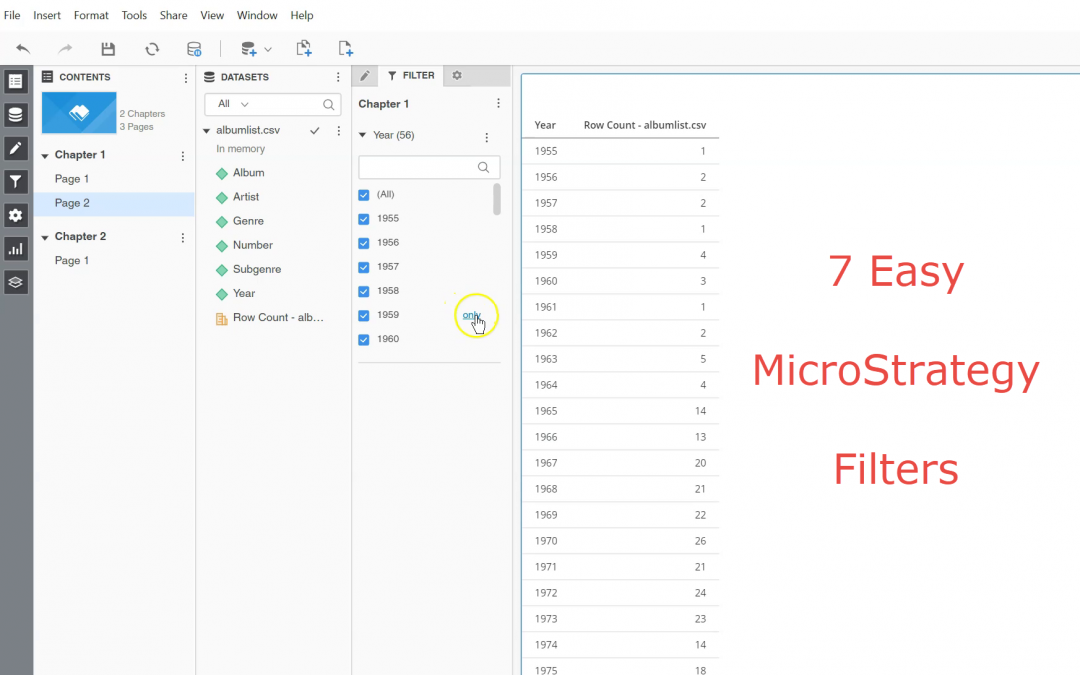
In this video, I show 7 easy ways to filter data in MicroStrategy, from chapter filters to the newly released visualization filters.
You can download MicroStrategy Desktop for free from https://www.microstrategy.com/us/get-started/desktop
You can download the 500 Greatest Albums of All Time dataset for free from https://www.kaggle.com/notgibs/500-greatest-albums-of-all-time-rolling-stone
To see how the original dossier was created, visit our tutorial at https://efficientanalyst.com/getting-started-with-microstrategy-desktop/
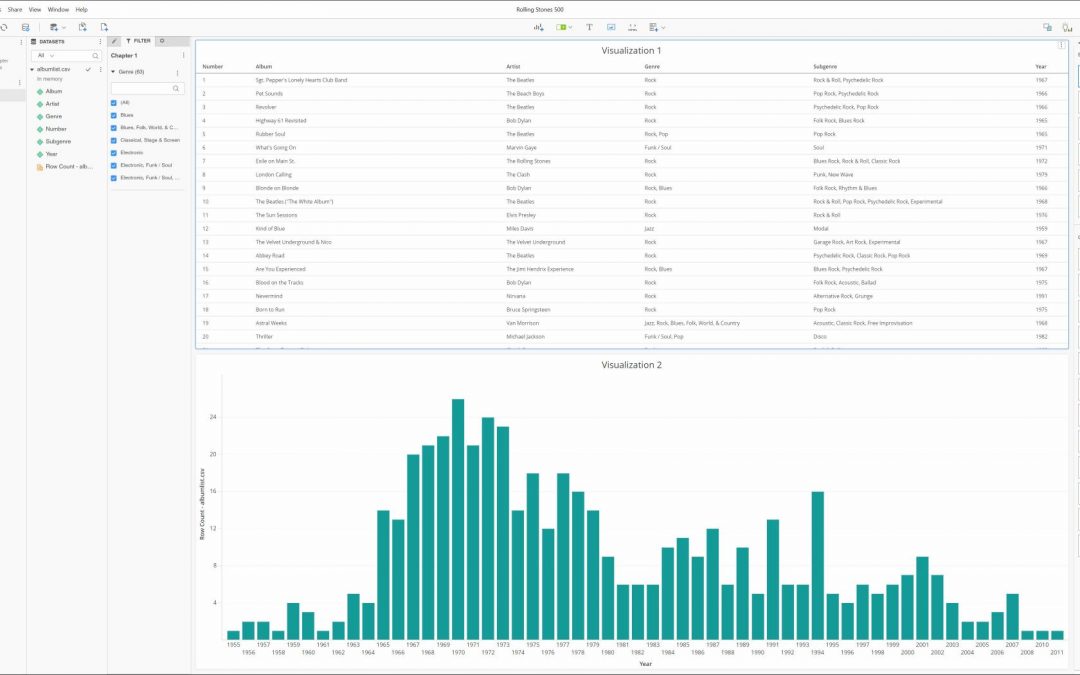
In this video, I show how how to get started with MicroStrategy Desktop. MicroStrategy is one of the leading Business Intelligence tool, and the MicroStrategy Desktop application is available for free.
You can download MicroStrategy Desktop for free from https://www.microstrategy.com/us/get-started/desktop
You can download the 500 Greatest Albums of All Time dataset for free from https://www.kaggle.com/notgibs/500-greatest-albums-of-all-time-rolling-stone
Recent Comments