Efficient Analyst
  • Home
  • COVID-19 Canada
  • COVID-19 World Dashboard
  • Excel
    • Beginner
      • Excel Basic Formulas: Sum, Average, Count, Max, Min
    • Intermediate
      • Creating an Excel Drop-down list using Data Validation List
      • Excel SumIf CountIf and AverageIf formulas
      • Using the Excel VLOOKUP function
  • MicroStrategy
    • MicroStrategy Create Derived Attribute – Convert Year to Decade
    • 7 Easy MicroStrategy Filters
    • Getting Started with MicroStrategy Desktop
Select Page
COVID-19 Canada April 30, 2020 update

COVID-19 Canada April 30, 2020 update

by jplaforest | May 2, 2020 | Canada

COVID-19 Canada Dashboard April 30, 2020 update – Click Image for High-Resolution Image.

COVID-19 World Dashboard April 30, 2020

COVID-19 World Dashboard April 30, 2020

by jplaforest | May 2, 2020 | World

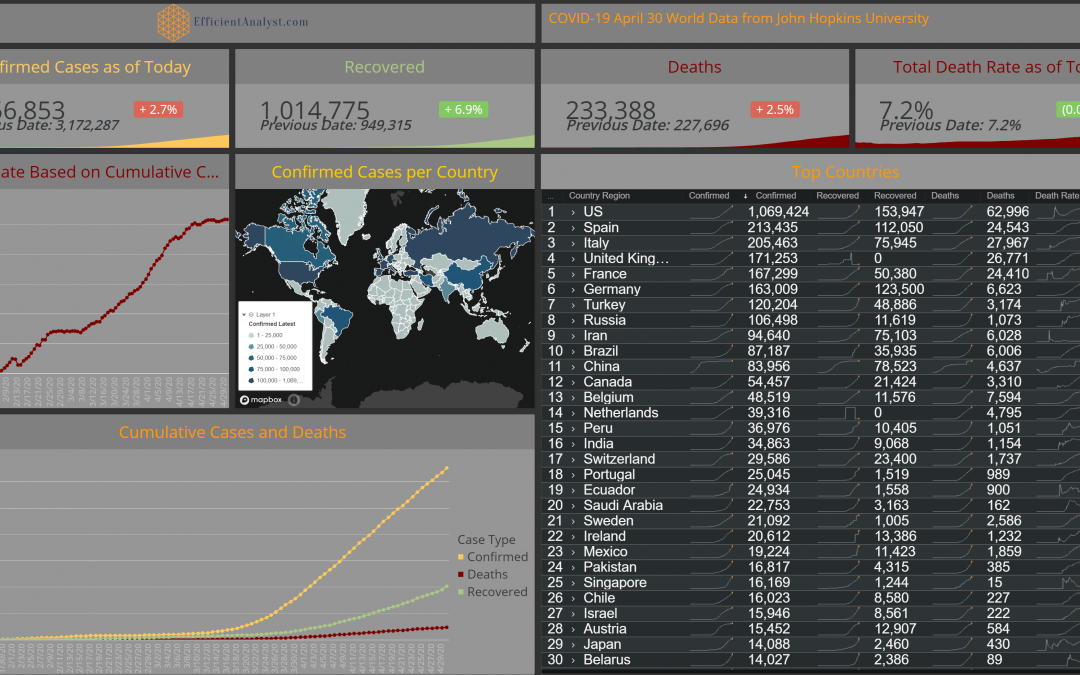
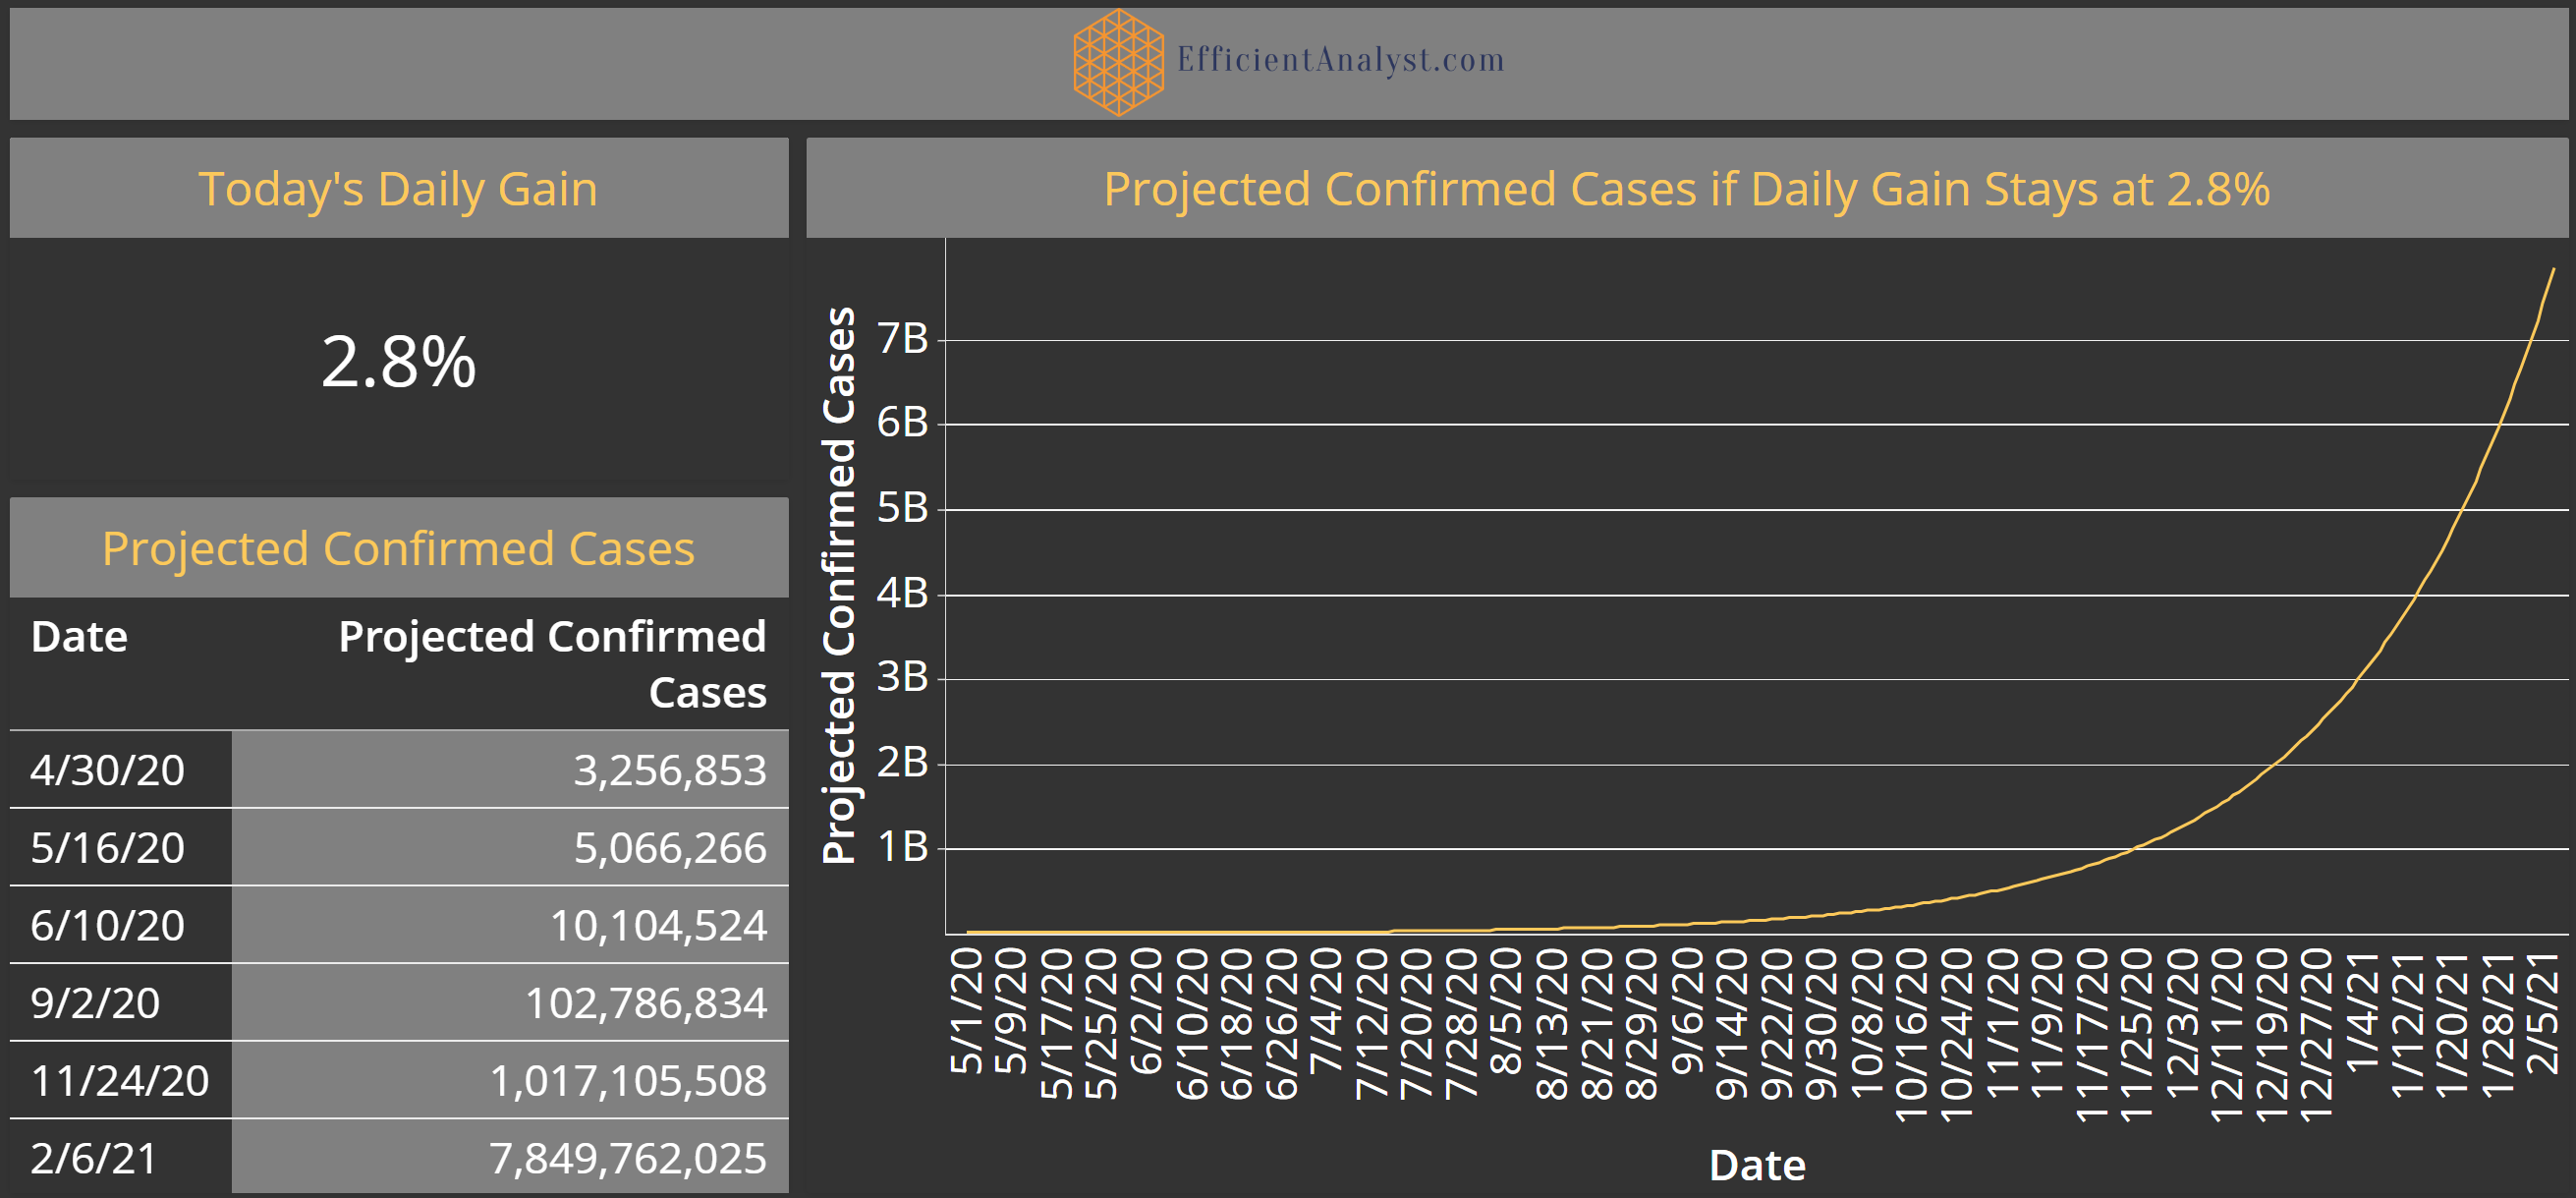
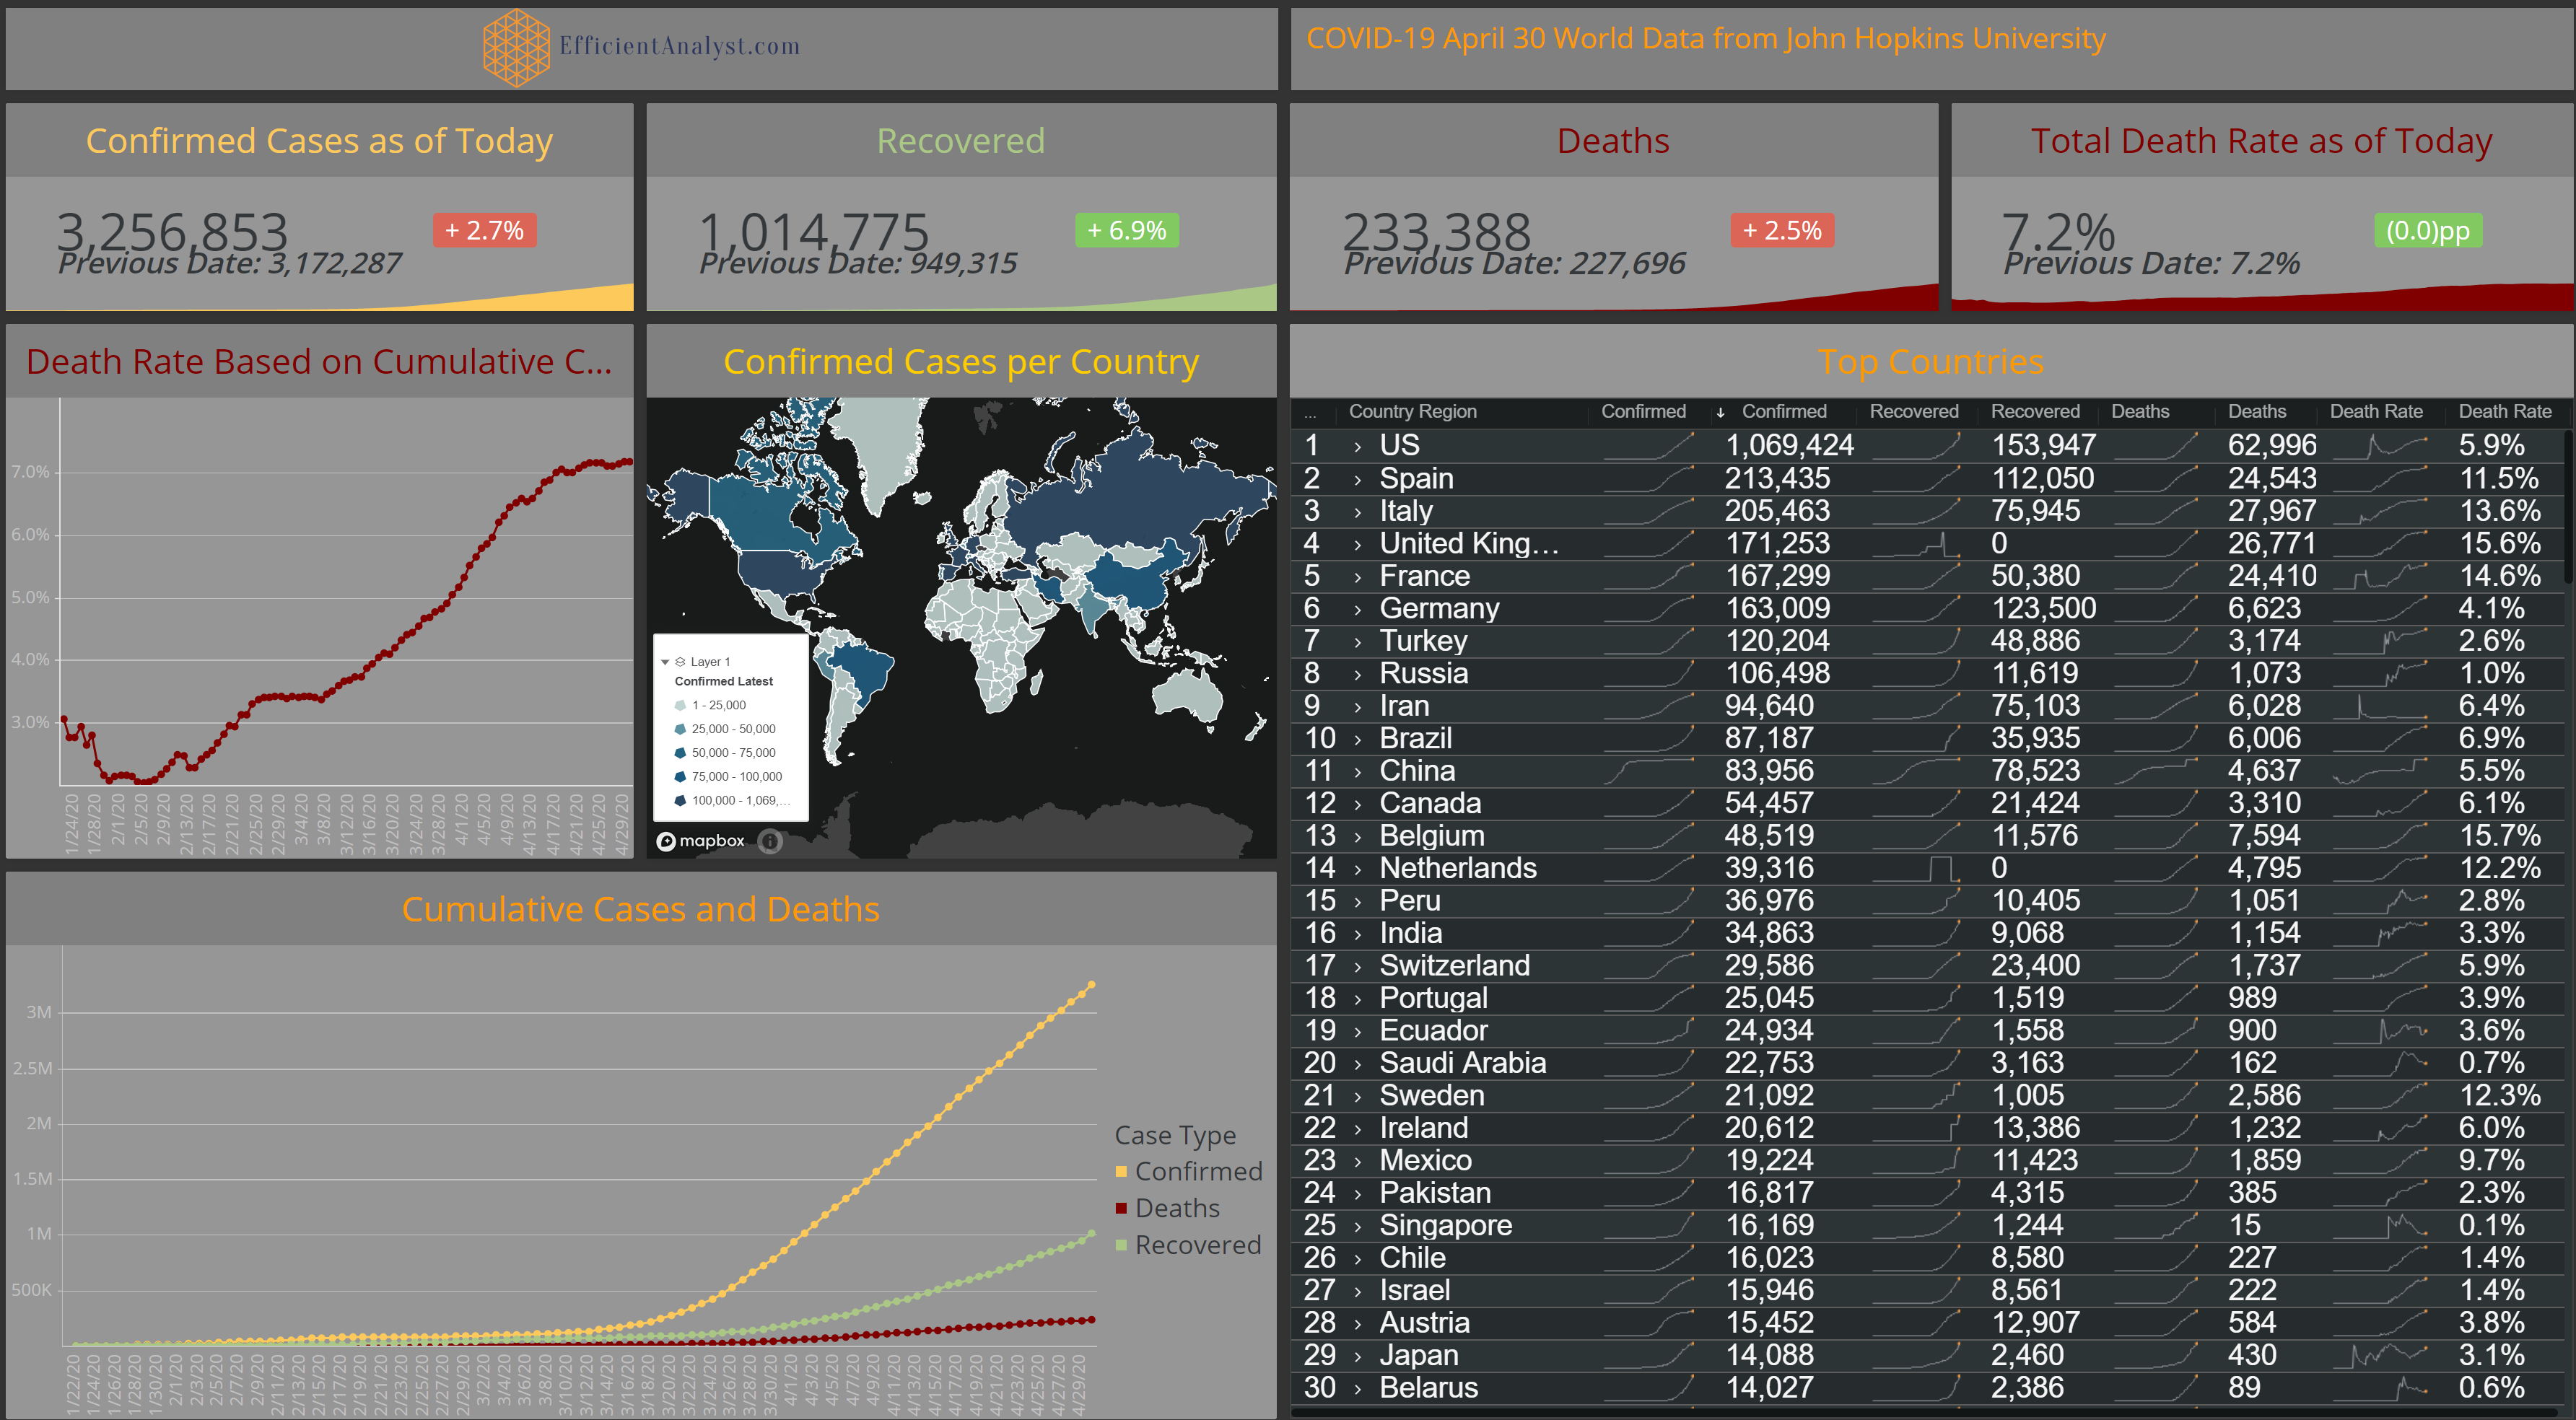
Projected Confirmed Cases if Daily Gain stays at 2.8%.
COVID-19 World Dashboard updated April 30, 2020. Click the image to see a high-resolution version.

Recent Posts

  • Should we start talking about a 3rd COVID-19 wave?
  • Introducing our new Interactive COVID-19 Dashboard
  • COVID-19 Canada April 30, 2020 update
  • COVID-19 World Dashboard April 30, 2020
  • COVID-19 Weekly updates

Recent Comments

  • 7 Easy MicroStrategy Filters - Efficient Analyst on Getting Started with MicroStrategy Desktop

Archives

  • November 2020
  • October 2020
  • May 2020
  • April 2020
  • March 2020
  • February 2020
  • December 2019
  • March 2017
  • May 2016

Categories

  • Announcements
  • Beginner
  • Canada
  • COVID-19
  • Education
  • Excel
  • Intermediate
  • MicroStrategy
  • Uncategorized
  • World

Meta

  • Log in
  • Entries feed
  • Comments feed
  • WordPress.org
(C) 2016-2020 - Website by Jean-Pierre La Forest of Studio JPIC
We use cookies to ensure that we give you the best experience on our website. If you continue to use this site we will assume that you are happy with it.Ok