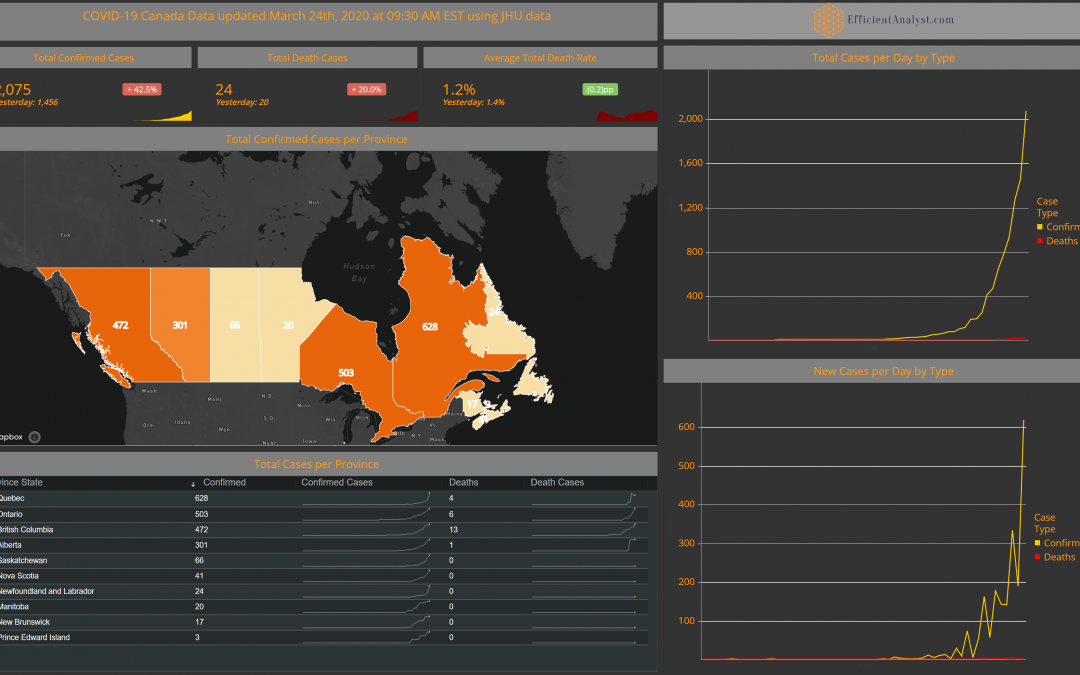
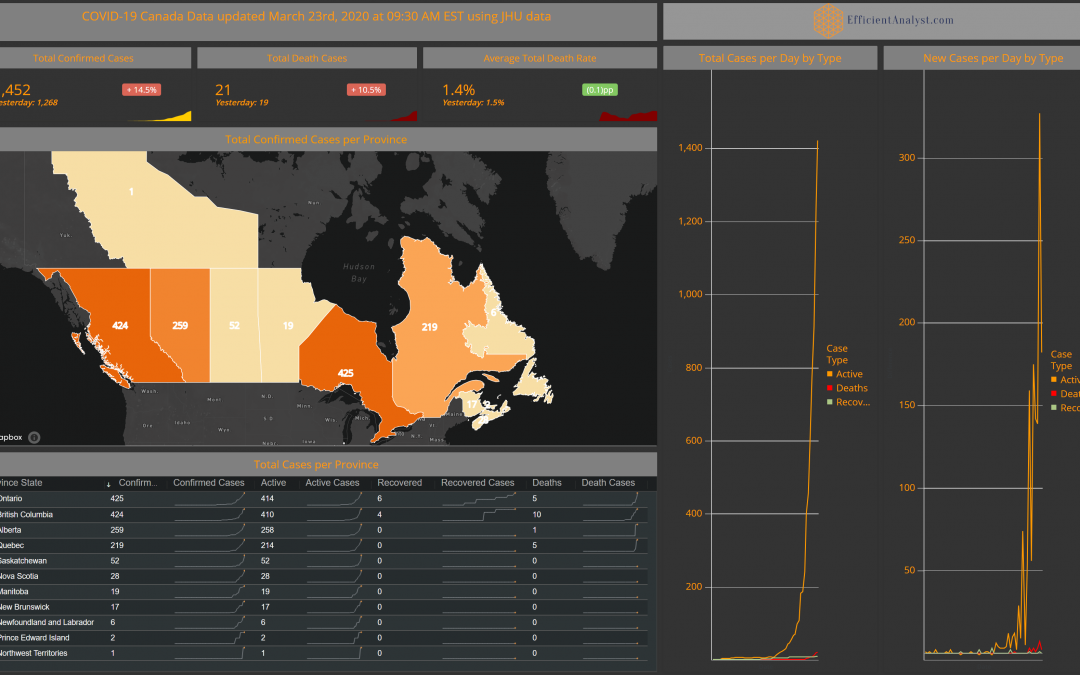
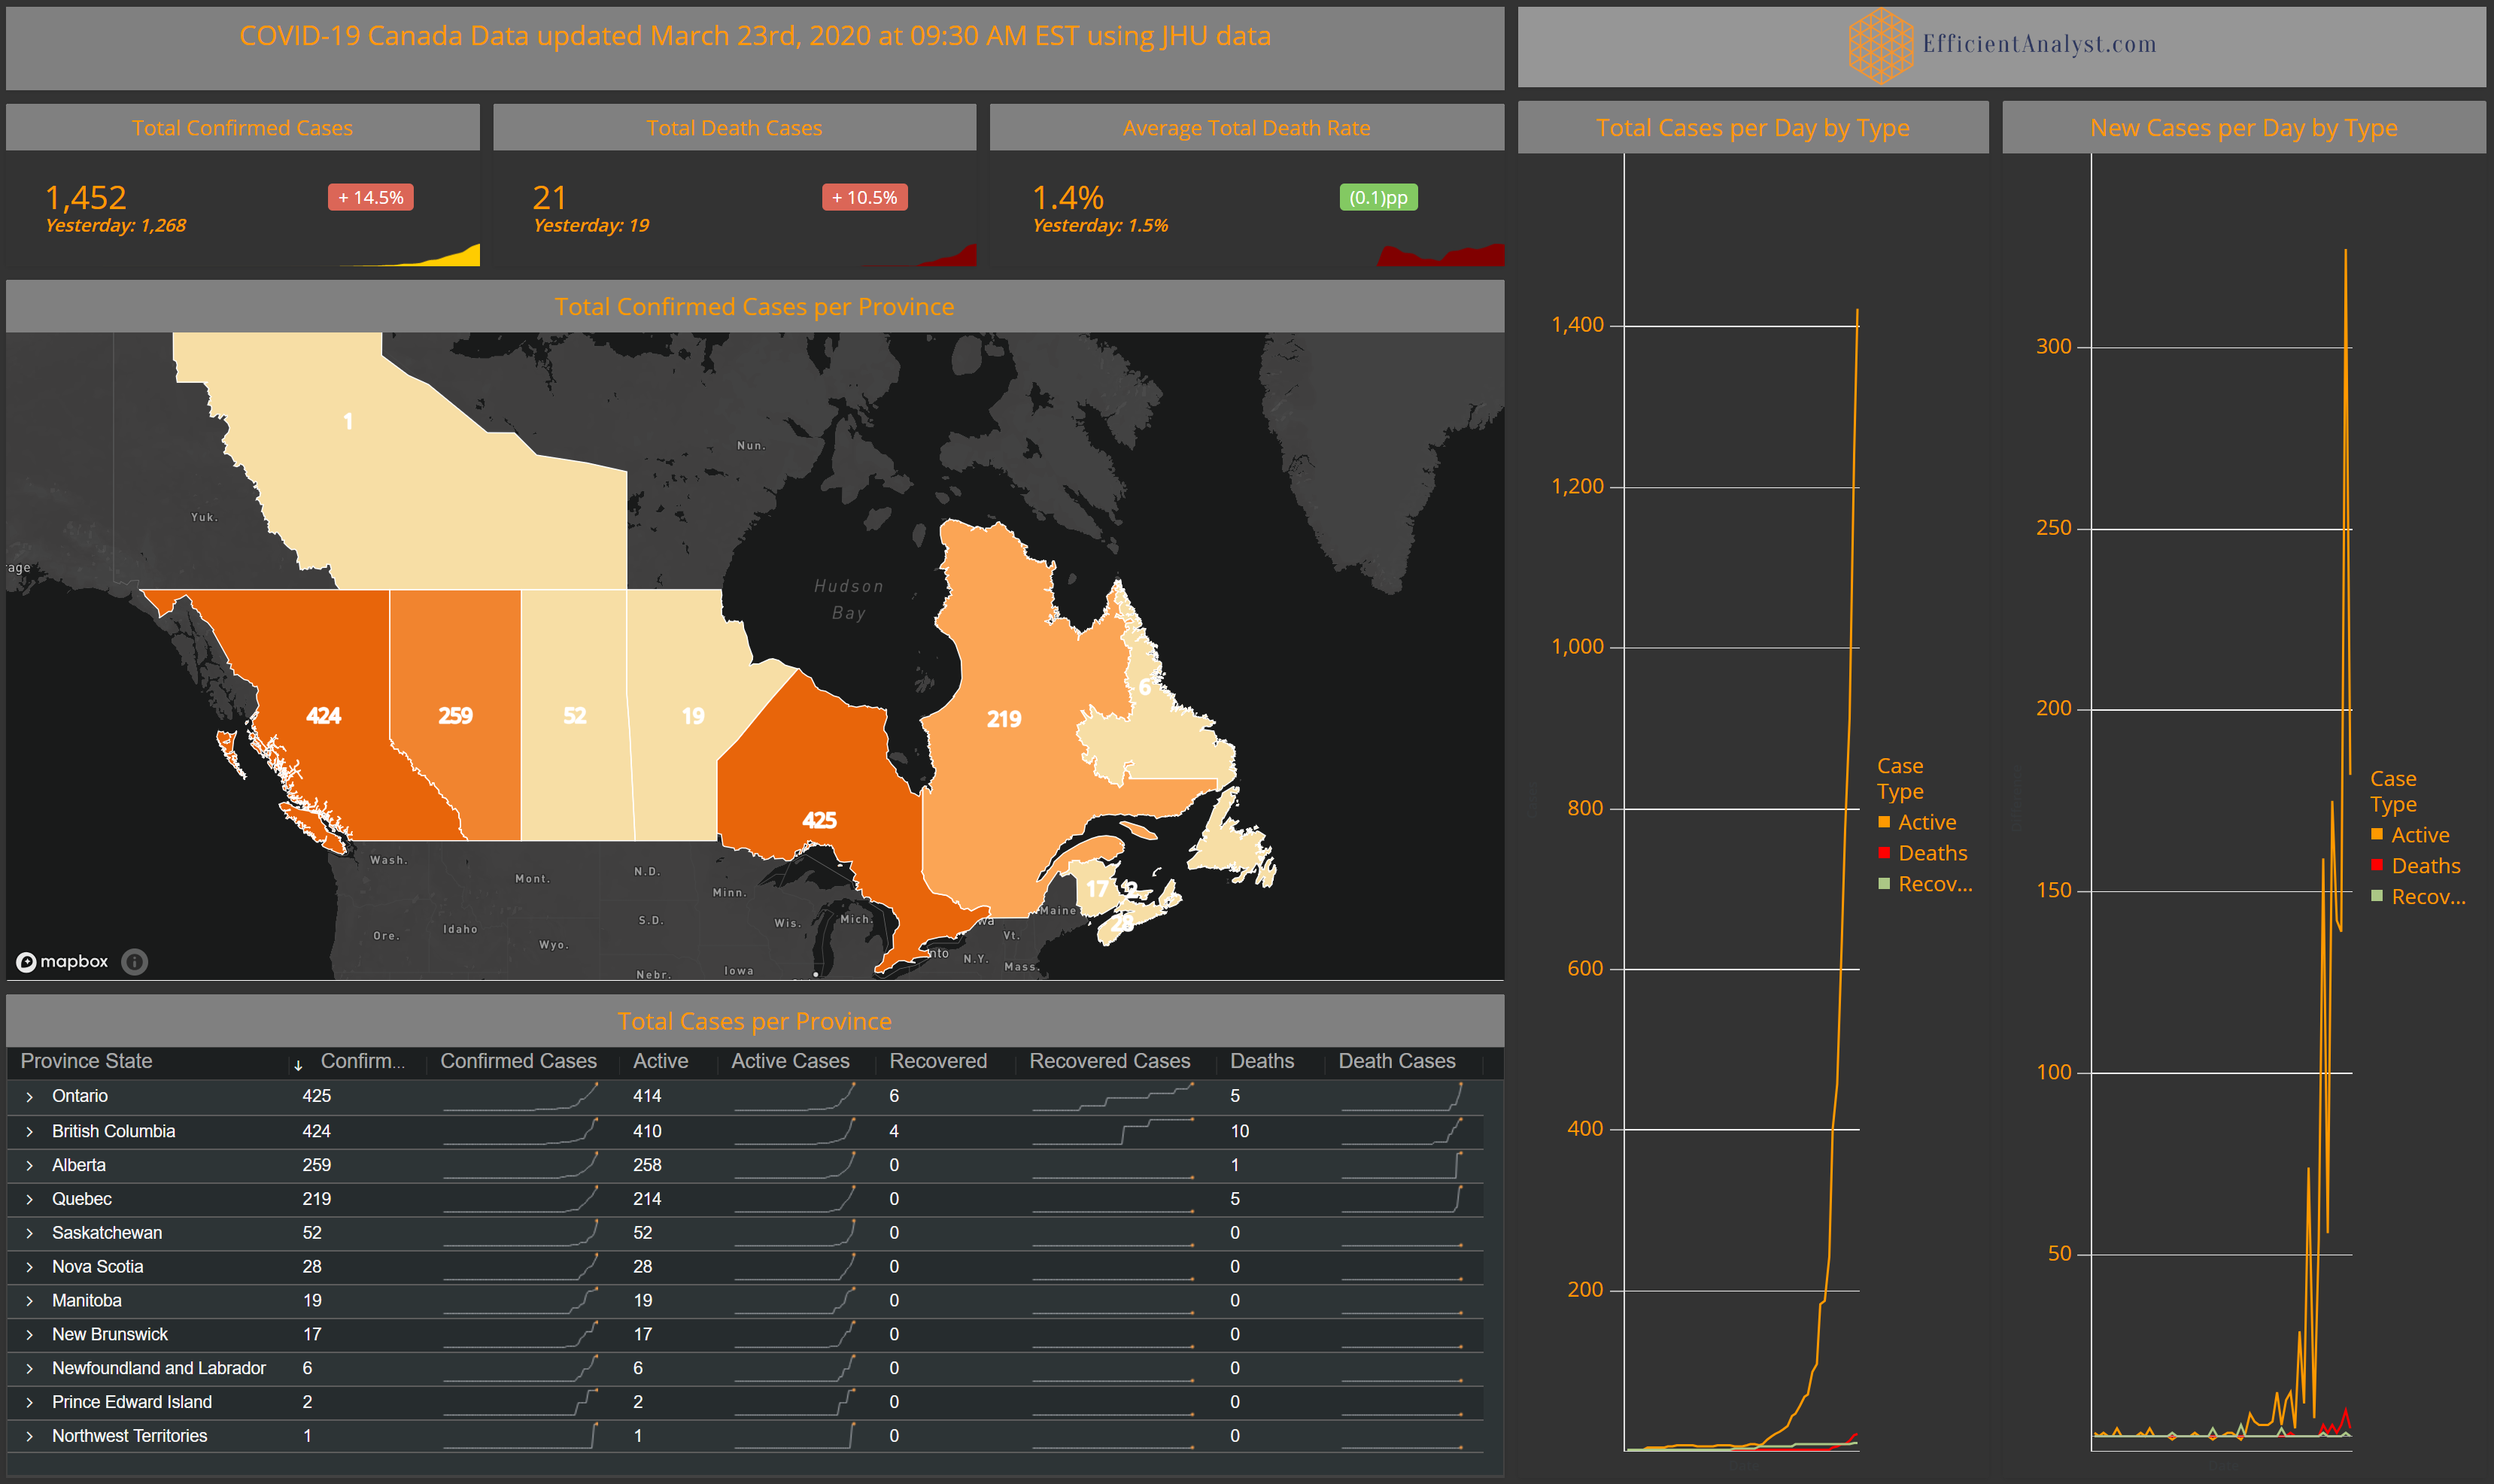
COVID-19 Canada March 24, 2020 update
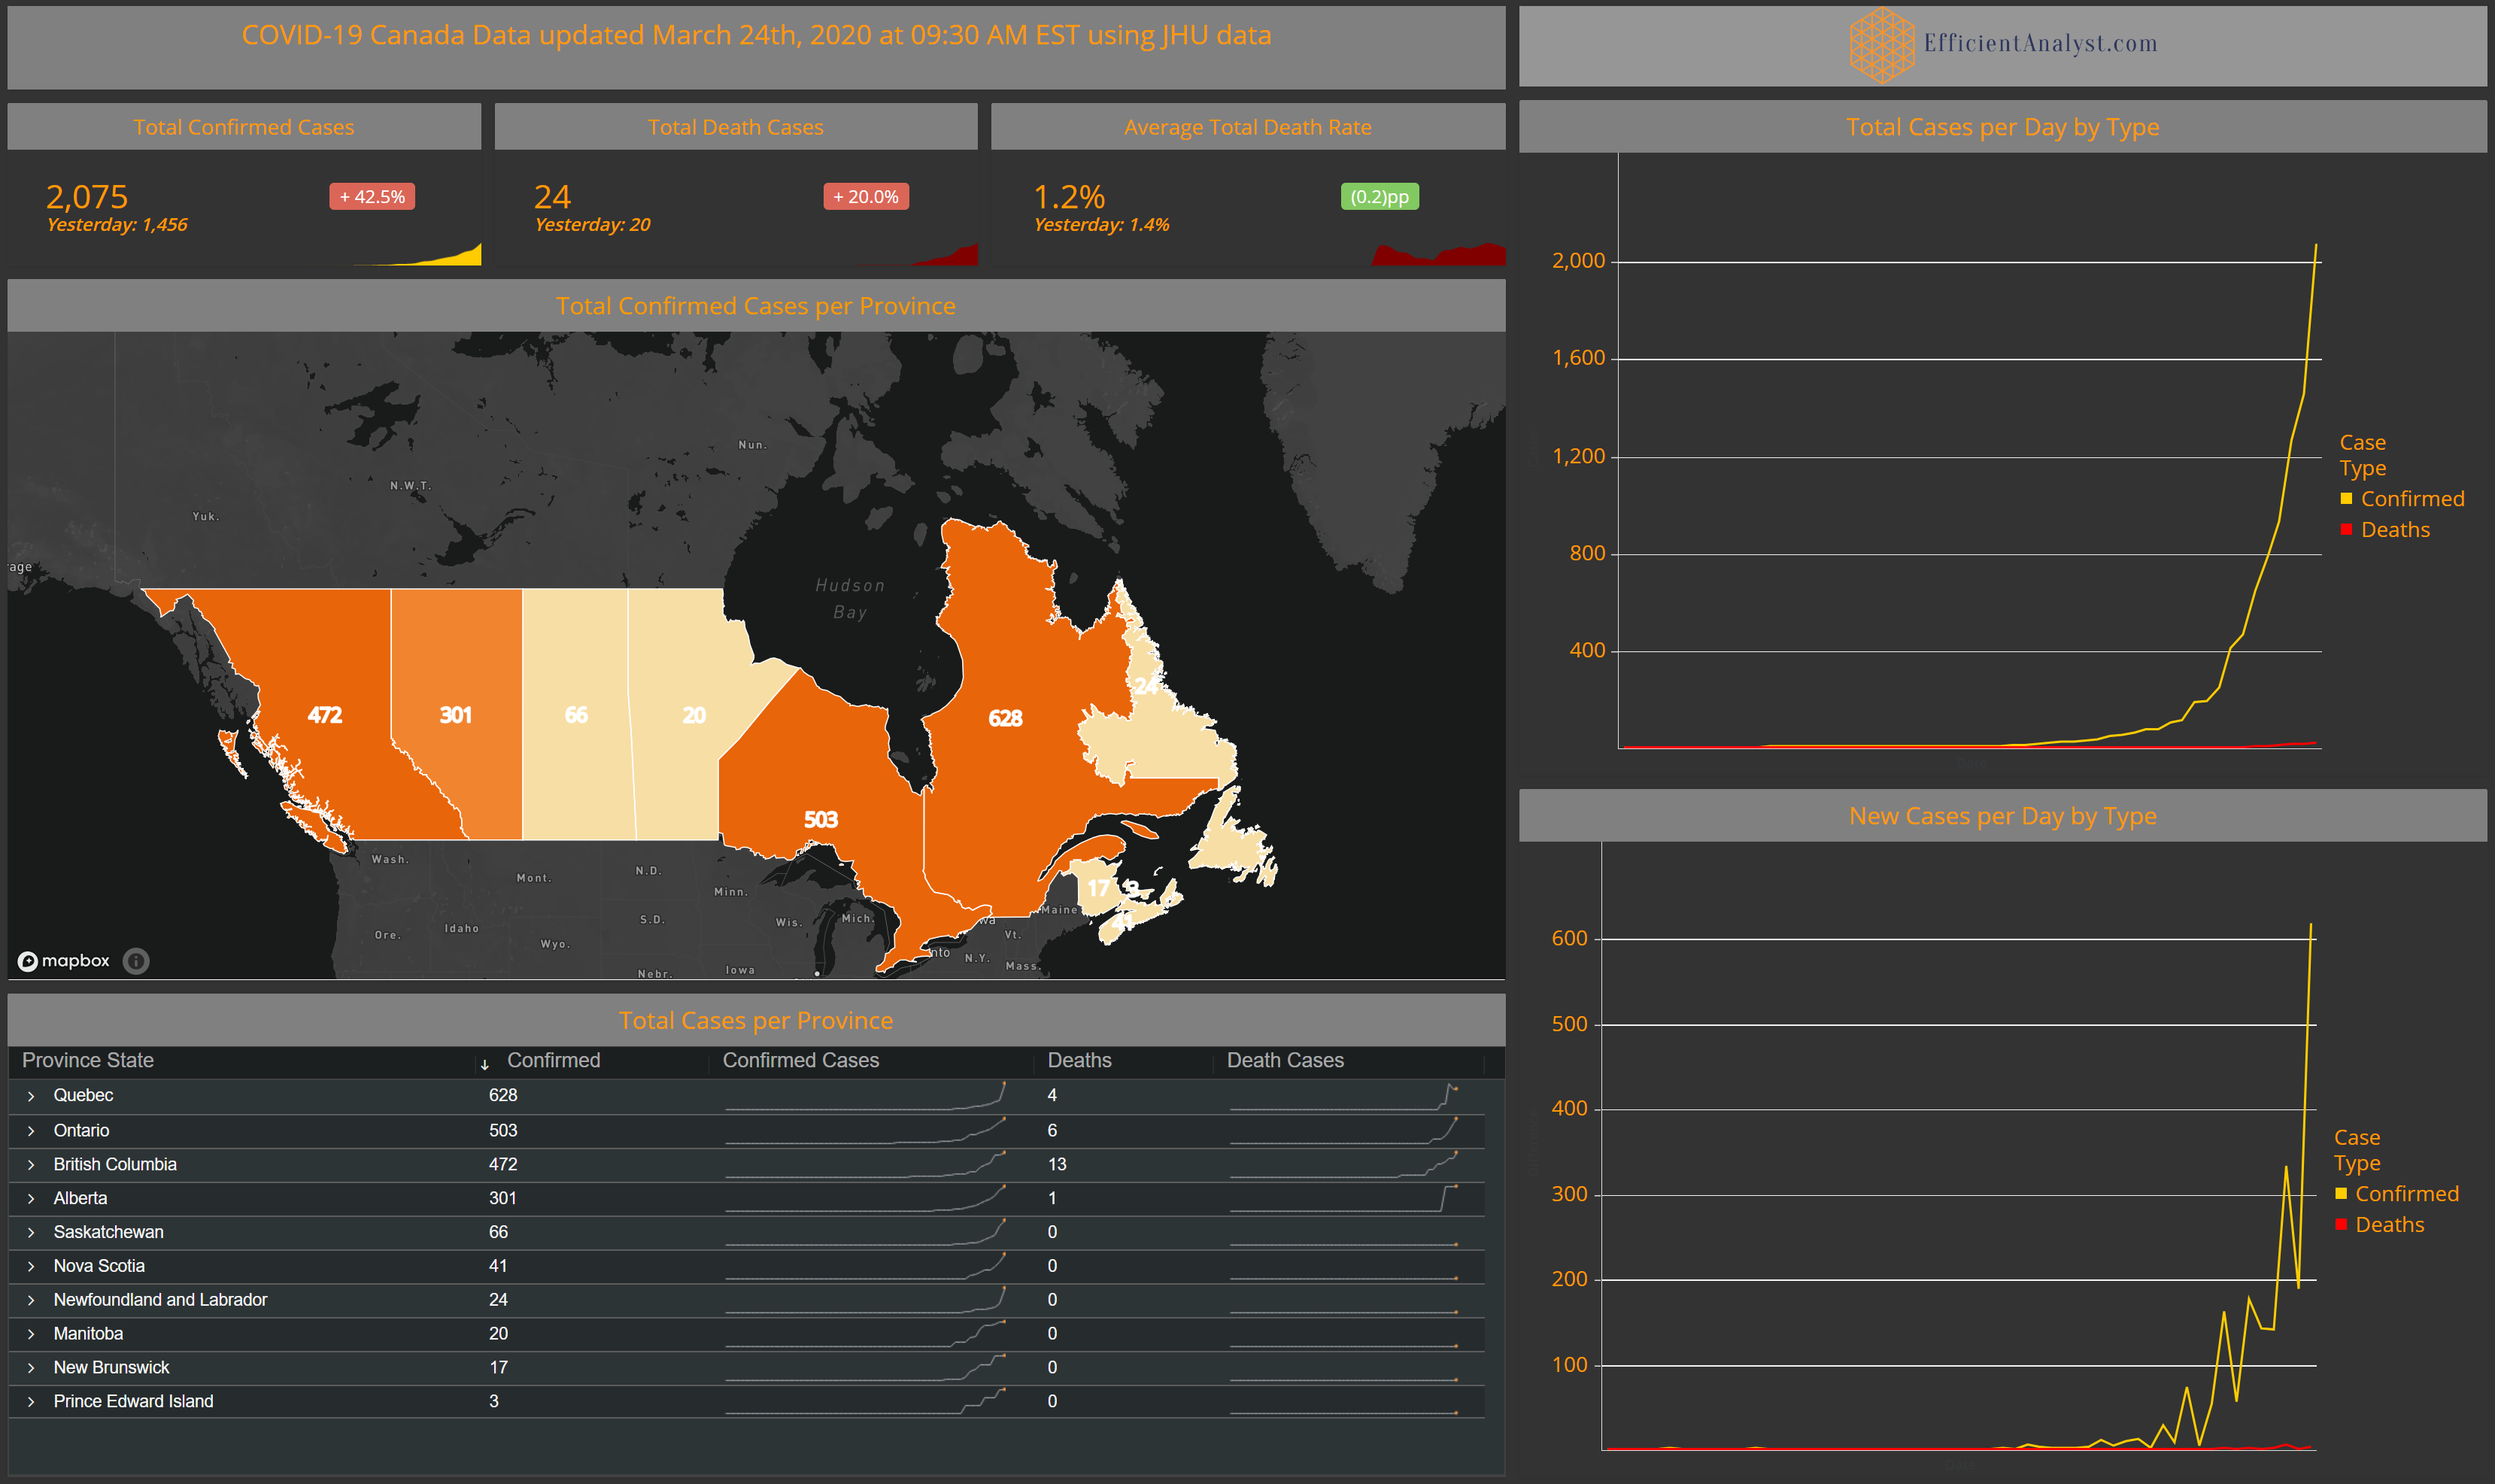
Note: as of March 24th, JHU no longer provides Active and Recovered as there doubts on validity of the data, so we removed those metrics from our report also.

Note: as of March 24th, JHU no longer provides Active and Recovered as there doubts on validity of the data, so we removed those metrics from our report also.
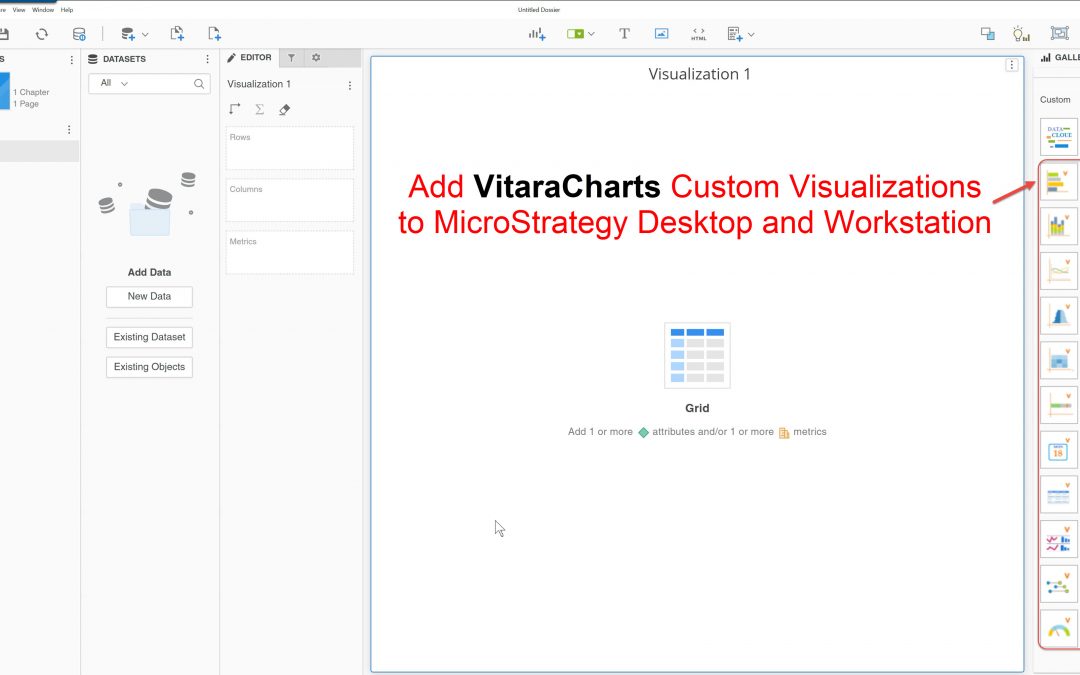
In this tutorial, I show how to add custom visualizations to MicroStrategy Desktop and Workstation such as VitaraCharts. VitaraCharts is a set of custom visualizations available from vitaracharts.com for free for MicroStrategy Desktop and Workstation, and for a license for MicroStrategy Web.
Requirements:
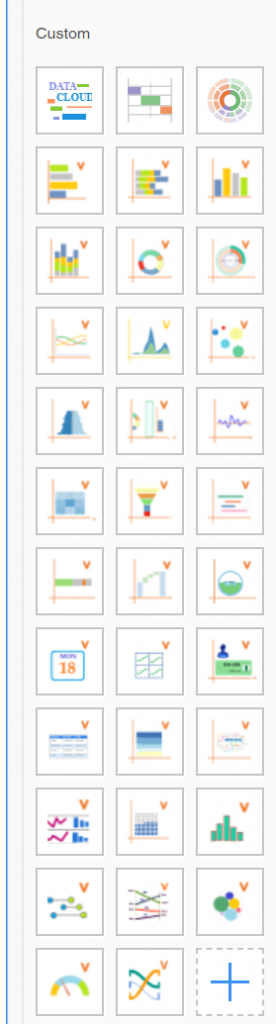
In the Gallery Panel, in the Custom section, click the + sign and select Import Visualization
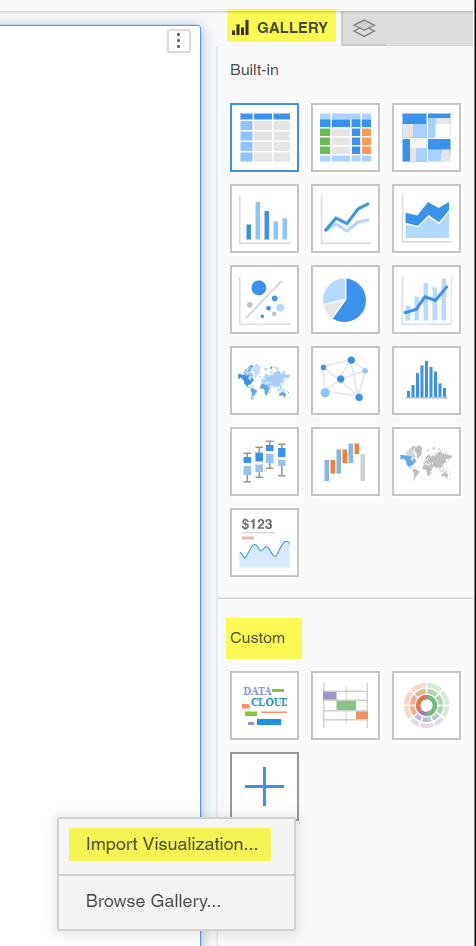
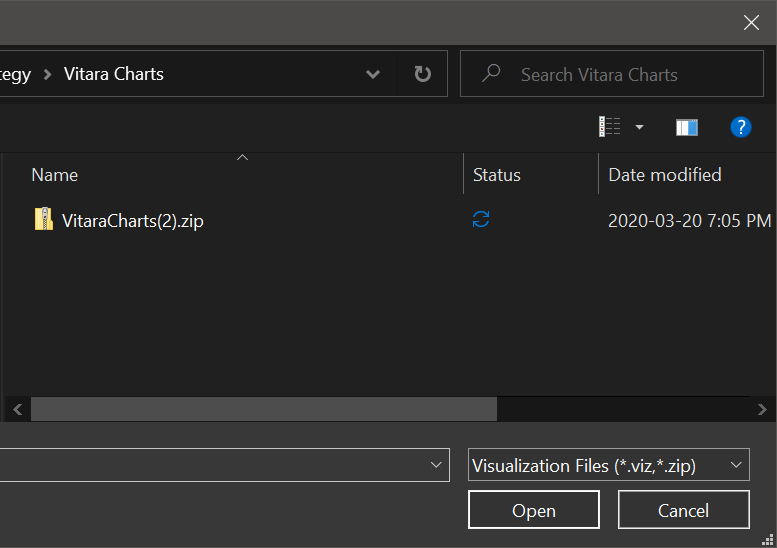
Browse to the location of your saved visualization, and select your visualization. You do not need to unzip it first, as long as it is in .viz or .zip format it should work.
Enjoy your new Visualizations!
Recent Comments